Support and Resistance Reversals happen all the time on all time frames and are very simple.
Previous broken support becomes resistance and previous broken resistance becomes support.
Here is a look at few examples from last few days alone.
– SP500 emini futures Spike high from overnight session on Thursday becoming support and low of the day on Friday. Also note few smaller s/r reversals in previous market sessions.

– ES emini support from one week, becoming resistance next week:

– Even after government intervention in the Franc earlier this week, support and resistance reversals still work:
– Gold chart from past 4 days with numerous s/r reversals:

– Euro stair stepping down and then up s/r reversal levels the past 3 days:

Support and resistance reversals are very easy to spot, happen in all markets on all time frames, when combined with other set ups are very powerful.
=============================
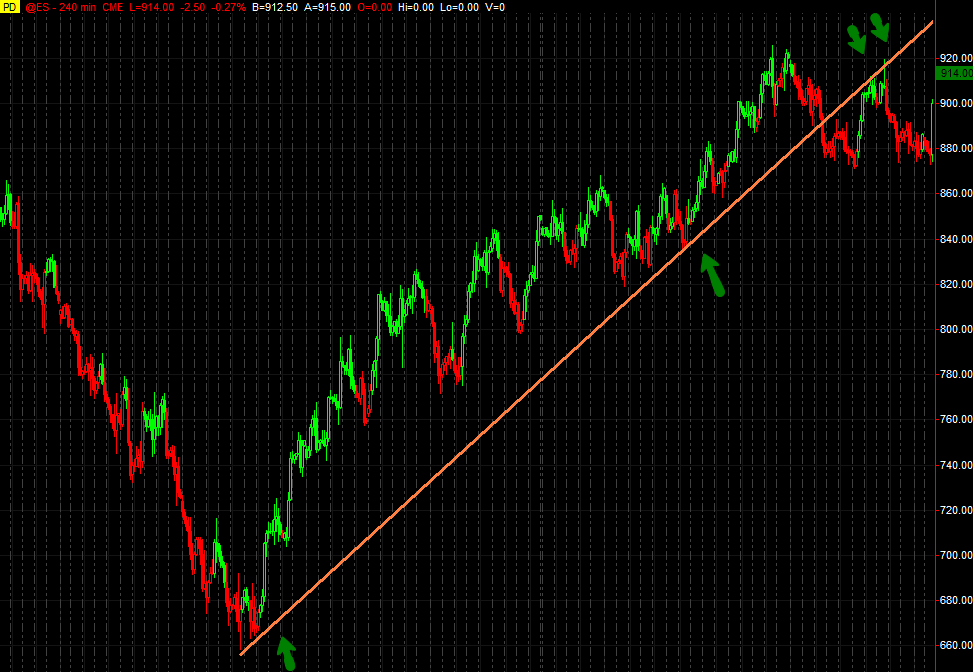
Support and resistance reversals are also valid with sloping trendlines, here is a great example during this recent rally of previous support becoming resistance on the SP500 emini

Only problem with diagonal support and resistance reversals is that price could “ride” up/down previous s/r line before reversing, thus I prefer horizontal support and resistance reversals since entries and stops are more clear.