Hey Traders,
few interesting thigns worth noting on the dailys after todays session:
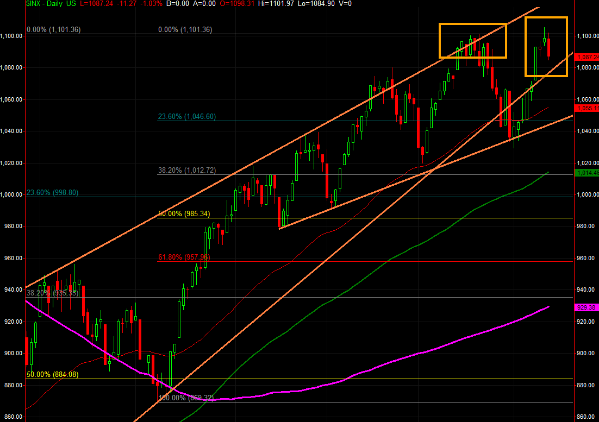
– Trades above previous rally highs on 2 consecutive days and failed to close above
– Today’s candle closed below the low of the high candle (say that 5 times fast), thus triggering a sell on the daily’s.
Here are some levels to be watching on the hourlys:
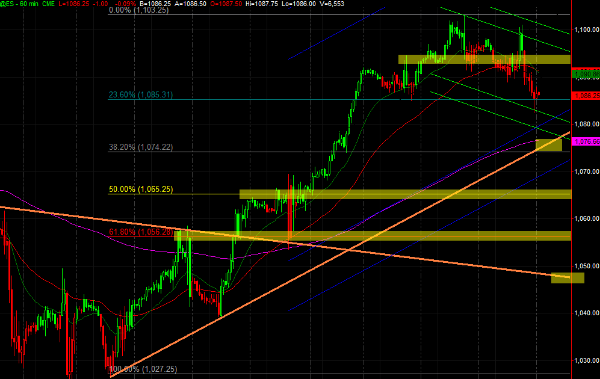
Resistance is the higlighted area – 50% retracement form today’s high, will update on the level later depending on what final low is made.
Support levels are highlighted:
– trendline + 200ema hrly + 38% retracement of recent move.
– 50% retracement and volume cluster
– 61% retracement and previous s/r band
– backtest of trendline that has been previously respected several times.
Will update when new technical developments take place.
Cheers