Hey Traders,
one of most historic months in market history is behind us, while I mostly trade off of 377tick & hourly charts, it is important to know where things stand in the bigger picture, so lets throw all the bias out the windows, rewind things 40 years back and take a look at monthly charts of SP500:
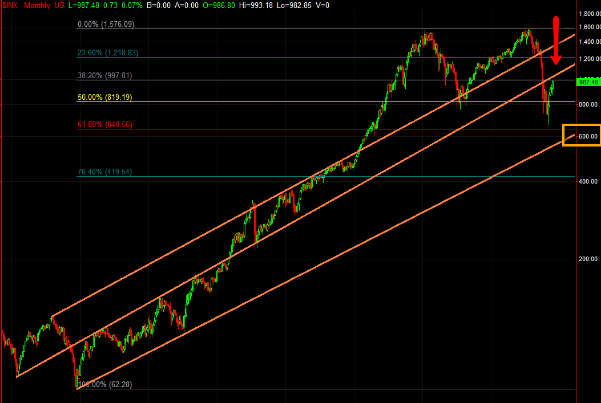
looking at monthly charts, there is no particular reason for SP500 not to trade up into mid 10##s to backtest the top of the channel, nor is there any support in sight on the way down , besides 40 year old trendline in low 600s.
On the weekly charts we are a lot closer to a key retracement level which is right below previous support line:
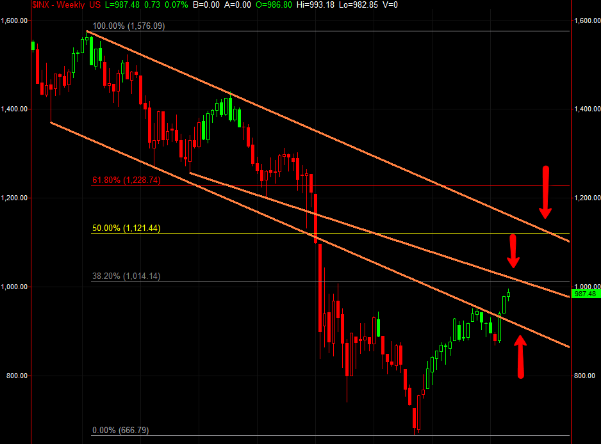
3 key areas highlighted are backtest of the bottom of previous channel that Sp500 has now traded into, 38% retracement of bear market and backtest of trendline, 50% retracement of bear market and top of previous long term channel.
Now that we looked at resistance levels on large time frames, here are the levels that bears would have to take out to try to get something going to the downside, firstly a look at the daily ES futures chart:
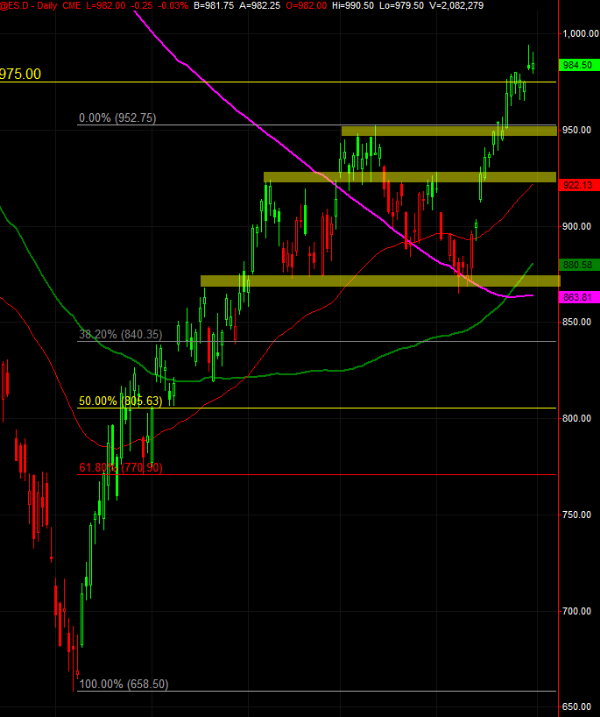
Firstly worth noting are the two shooting star daily candles suggesting exhaustion of the move and indecision. There is unfilled gap at 975, major s/r level in 955-988 area, then previous resistance level of pattern not to be named (as it caused too much pain for too many people thx to whole planet looking at it) and then the same support level with now rising 200 day moving average.
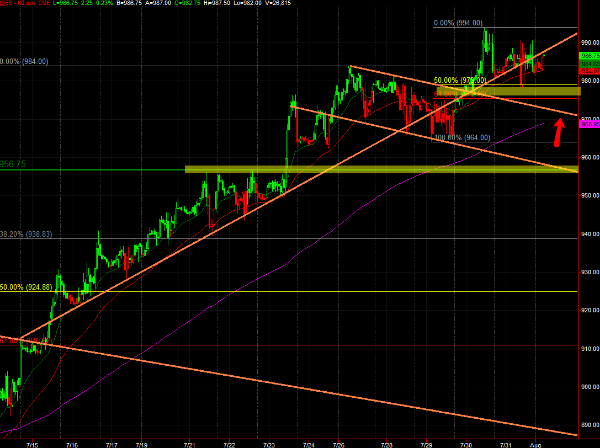
On the hourly charts would first be looking for support in the retracement zone of recent run up which marked Friday’s low almost to a tick, below 200ema hourly and backtest of previous channel, with key 954-957 area below:
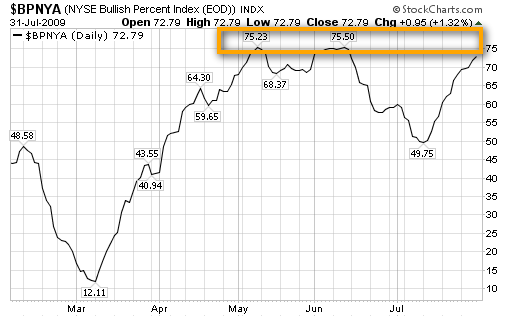
Another thing worthwhile noting that is Bullish Percent Index is slowly but surely approaching the previous multi-year double top seen earlier this year:
While in the last few weeks we learned that dollar strength, earnings, news or any other events are absolutely meaningless when there is great momentum behind the markets. Will be watching key levels mentioned in this upside to possibly start building bearish case; with all eyes this week being on the Dollar, earning and employment.
As always will keep posting key intraday levels and internals via my twitter account @esecfutures as well as some intraday and all daily updates right here on esecfutures.com
Have a great trading week
Cheers
Vlad
p.s.
If you find this content useful/ worthwhile reading, feel free to retweet my updates or forward them to to your friends, that would be greatly appreciated.