Hourly chart is rather self explanatory, will be watching following trendlines and fibs, key levels are highlighted:
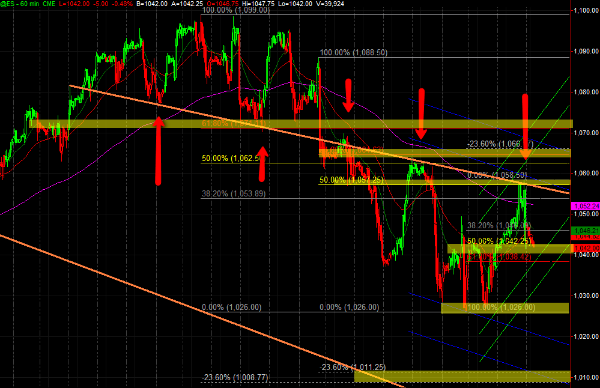
Break of the lows and the lowest highlighted area on the hourly also lines up with a fib from july lows on the daily:
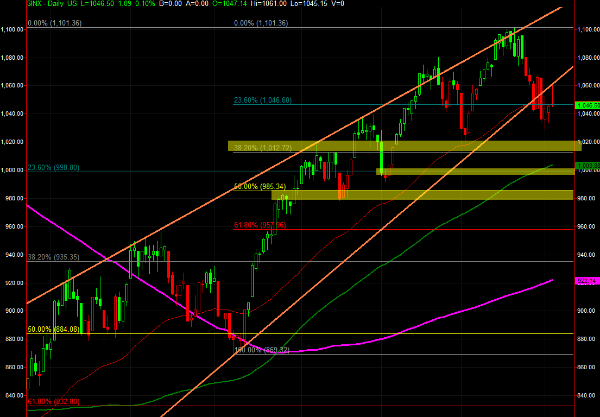
Also note a boji daily candle ( obviously, its a term for backtest Doji 😛 ) on the daily chart. Another thing worth noting is that market has worked off some oversold conditions and considering the candle formation and put/call ratio have to favor downside slightly, but as always will have to listen to market for clues.
Thats about all as far as key levels. Most of this stuff I tweeted about live on twitter, aka Backtest / fib resistance levels and some other stuff, so if you aren’t feel free to follow @esecfutures (while i might dissappear for a month or two again, at least you might be able to catch me on a lucky guess day)
Some review (in case you missed some of the tweets)
Second high at the fib resistance zone was made with divergences in both VIX and A/D:
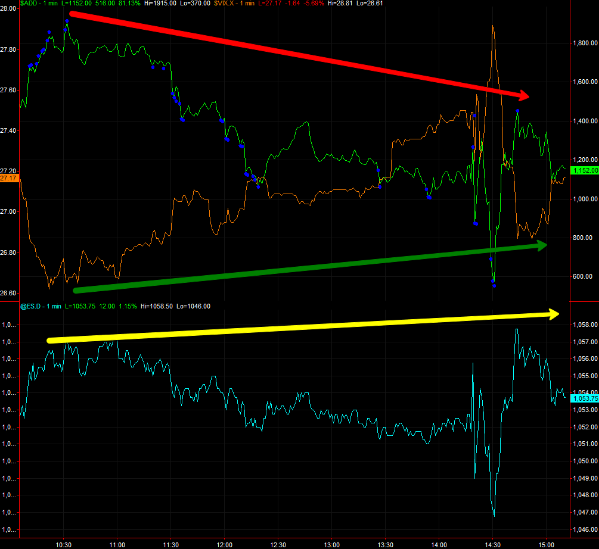
Initial target was 1046 – intraday low, VWAP -2sig and also 5minute -3sig as well as 200ema (also note the second top at +2vwap, previous high, fibs, whlie showing divergence on internals):
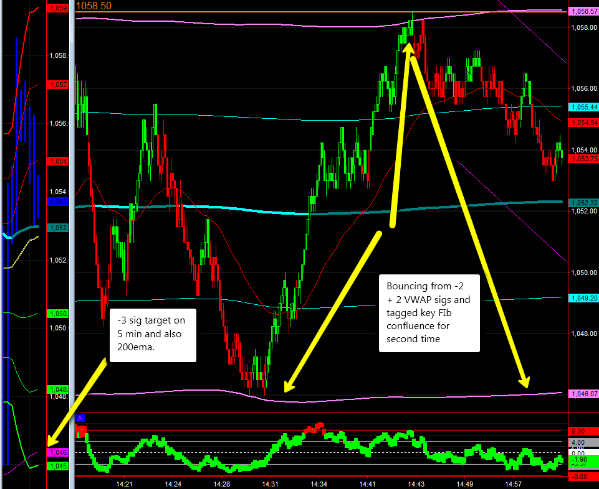
After that target was reached, target of the intraday double top and 50% retracement from the bottom of the move lined up in 1042s (see hourly chart, we are currently stuck at it overnight)
Cheers
Good trading to all
Vlad
——————-
Thanks to all who have emailed, commented and tweeted to me, everything is going better, hopefully I will be back full force “soon”